
After a brief hiatus during the beginning of summer, we are back to our blog series about common student weaknesses on the ACT. Today, we’ll take a look at statistics questions. Statistics questions can be challenging for a number of reasons. Not only can the subject matter be difficult and wide-ranging, but the vocabulary of these questions can be confusing, particularly for students whose first language is not English.
Let’s start with some definitions. There are four main terms that all students need to understand in order to answer basic statistics questions. The first is mean. The mean of a set of numbers is the average of those numbers. To find the mean, we simply add all of the numbers and divide by the amount of numbers that we have. For example, in the set of numbers 4, 5, 6, 6, 8, 13, 14, the mean is 8. Why?
4 + 5 + 6 + 6 + 8 + 13 + 14 = 56
56 / 7 = 8
The second important term is median. The median of a set of numbers is the middle number when they are ranked in ascending order. Let’s look at the set of numbers 14, 2, 5, -7, 21, 12, 10. Here’s how we can find the median:
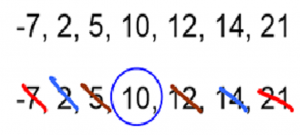
First, we order the numbers from smallest to largest. Next, we cross of pairs of numbers, starting from the outside, until we arrive at the number in the middle.
The third important term is mode. The mode is simply the number that occurs most frequently in a set. For example, in the set 4, 5, 5, 5, 7, 9, 9, 17, 21, the mode is 5 because it occurs three times and no other number occurs three or more times. Let’s take a look at a slightly more difficult example:
-12, -4, -4, -4, -2, 3, 3, 4, 8, 8, 8, 11
Things aren’t as clear here. Both -4 and 8 occur three times in our set. These sets are called bimodal: both -4 and 8 are modes.
Let’s take a look at a slightly harder problem. Many statistics questions give us imperfect information about different groups and ask us to draw inferences. Here’s an example: “In a class of 20 students, some play guitar, some play piano, some play both, and some play neither. If 3 people play only guitar, 6 people play both, and 5 people play neither, how many people play piano?”
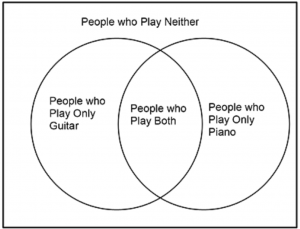
To solve this, we want to use a Venn diagram. Here’s the general gist of a Venn diagram:
Applying the numbers given to us in the problem, we get:
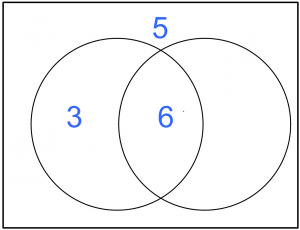
What’s our missing number? Recall that there are 20 students in the class, so all of the numbers must add to 20. The final section of our Venn diagram must be 6. But that’s not our answer! The question was “how many people play piano?” That amount should include people who play only piano as well as people who play both piano and guitar. We need to add 6 + 6 = 12 people who play piano.
Related Posts
How To: Deal with Percentage Questions
How To: Substitute Numbers for Variables


