

This week we are taking a closer look at the Graph Questions on the redesigned SAT Reading section.
What does this question look like?
One or two of the passages on the test will have some form of graphical data. This data might appear as a bar graph, a line graph, a pie chart, or a basic chart of numbers. Students will normally see these graphs only on Social Science and Natural Science passages.
There will be three types of questions that ask about these graphs:
What does the data say? These questions just ask students to read the data in the graph (see #1 below). This type of question makes up 2/3 of all graph questions and is usually the easiest.
Does the data support the author? These questions ask students how the data relates to the argument of the passage (see #2 below).
How would the author respond to the data? These questions ask students to predict how the passage might agree, disagree, or be modified based on the data.
Example:
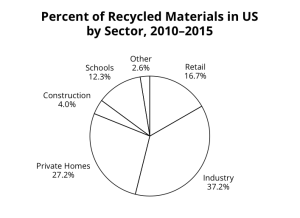
1. Which choice is supported by the data in the first figure?
A) The amount of material recycled by retail is greater than that recycled by industry.
B) Schools have run more recycling programs than construction projects have.
C) Private homes recycle more material than retailers do.
D) The amount of material recycled by construction and retail combined is equal to the amount recycled by industry.
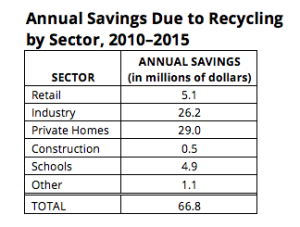
2. Do the data in the table support the author’s argument about the economic efficiency of private sector recycling?
A) Yes, because private homes do not make up the largest percentage of recycled materials in the US but do save the most money by recycling.
B) Yes, because construction makes up a small percentage of recycled materials in the US and saves the least about of money by recycling.
C) No, because private homes do not make up the largest percentage of recycled materials but do save the most money by recycling.
D) No, because construction makes up a small percentage of recycled materials in the US and saves the least about of money by recycling.
How often does this question appear?
Each test will contain approximately 5–6 Graph Questions (10% of the section).
How does this compare to the current SAT?
The current SAT doesn't have graphs in the Reading section, so these questions are entirely new. In many ways these questions look a lot like the Science section of the ACT. They appear to be the way that the SAT is trying to match the ACT’s content without going to the trouble of adding an entirely new section.
What does this mean for students?
Graph Questions will require that students learn an entirely new set of skills for the SAT. First, they must be sure they read carefully. Many of the questions ask students to look at only specific pieces of data in a chart. Precision is key. Second, the Graph Questions often have many moving parts that students need to juggle (data, text, numbers, relationships, etc.). Learning to break down the questions and answers while keeping it all organized is going to be fundamental to any test prep. Finally, students will need to learn how to quickly search the text of the passage for specific details when asked how the author might respond to the graphs.
Also note that though these questions are similar to the ACT Science section, this does not mean that if you are bad with graphs and science, both the SAT and ACT now are equally hard for you. The graphs only make up 10% of one section on the new SAT and 100% of one section on the ACT.
Will this question be on the PSAT?
Yes, but Graph Questions may make up a smaller portion of the PSAT, only 6-8% of the section.
--
Stay updated on the changes coming to the SAT.
Fill out the form below and you'll be the first to receive sign-ups for upcoming webinars and workshops, free resources, and updates from the College Board.
[vfb id=28]


